Richest Counties in North Dakota (2025)
by Kristen Carney ![]()
Updated: December 17, 2024
Richest County in North Dakota
The richest county in North Dakota is McKenzie County with an average household income of $131,562 as of 2023 and 14,252 people as of 2023 according to the most current Census data available (citation).
| Rank | County | Population | Average Income | Median Income |
|---|---|---|---|---|
| 1 | McKenzie County | 14,252 | $131,562 | $88,289 |
| 2 | Dunn County | 4,019 | $131,547 | $94,688 |
| 3 | Burke County | 2,134 | $129,023 | $96,339 |
| 4 | Williams County | 39,113 | $119,610 | $90,224 |
| 5 | Divide County | 2,135 | $110,444 | $89,297 |
| 6 | Bottineau County | 6,349 | $109,394 | $83,460 |
| 7 | Morton County | 33,895 | $109,260 | $79,483 |
| 8 | Burleigh County | 100,012 | $108,697 | $84,948 |
| 9 | Traill County | 7,908 | $105,020 | $88,289 |
| 10 | Griggs County | 2,248 | $103,858 | $64,737 |
| 11 | Mountrail County | 9,383 | $102,926 | $81,292 |
| 12 | Oliver County | 1,879 | $102,691 | $76,953 |
| 13 | Billings County | 1,034 | $102,656 | $81,250 |
| 14 | Cass County | 196,362 | $101,854 | $75,023 |
| 15 | Ward County | 68,332 | $101,341 | $79,273 |
| 16 | Cavalier County | 3,596 | $101,179 | $67,064 |
| 17 | Stark County | 33,001 | $99,254 | $80,744 |
| 18 | Dickey County | 4,900 | $98,454 | $63,125 |
| 19 | Richland County | 16,558 | $97,675 | $72,524 |
| 20 | McLean County | 9,832 | $97,533 | $81,847 |
Median Income versus Average Income: Which Should You Use?
We usually suggest using median income data – either instead of or in addition to – average income data as a true indicator of wealth. If you haven’t thought about median versus average since your last standardized test, you aren’t alone. Here’s what they are:
- average is the sum of a set of numbers divided by the count of numbers in the set
- median is the middle number in the set of numbers
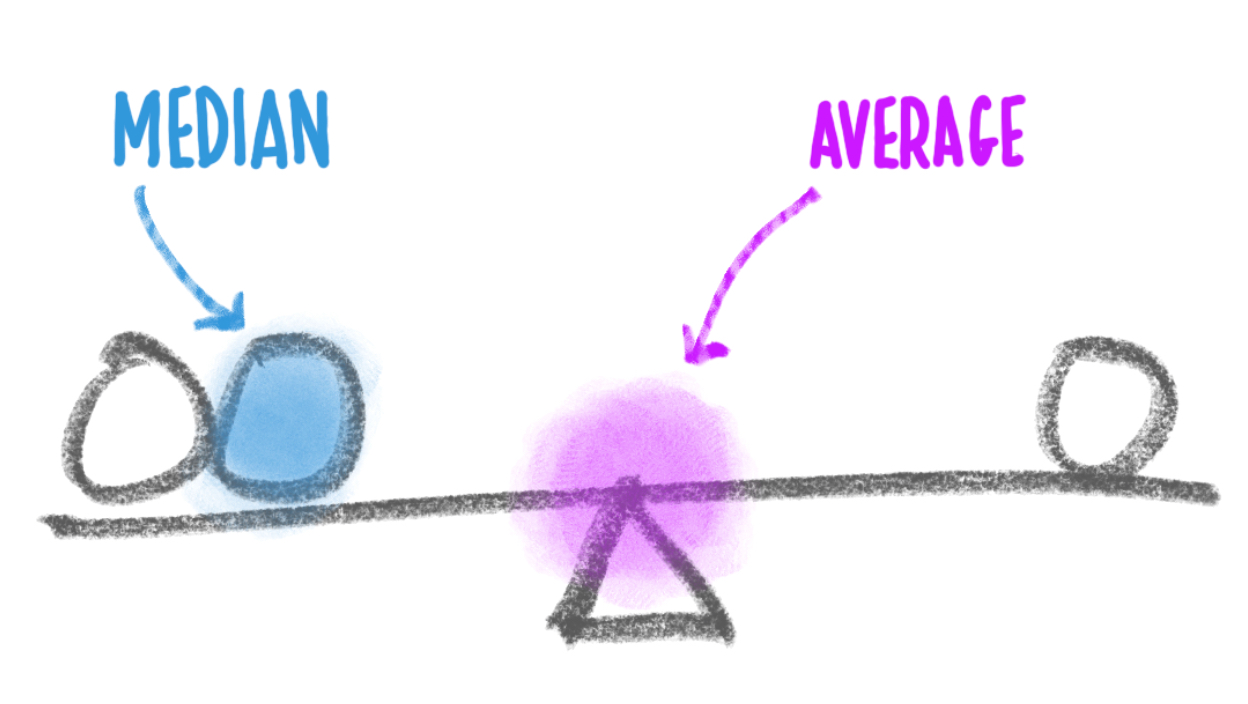
Now let’s say you had the following simplified set of income data.
Household 1: $30,000
Household 2: $50,000
Household 3: $1,000,000
The average income for this set is $360,000. The outlier data point ($1,000,000) skews the average WAY up. Conversely, the average income would be skewed WAY down if someone had an income of $500. The median income for the same data set is $50,000. Outlier data doesn’t skew the median.
Most Business Owners Should Use Median Income
So most business owners should use the median income as a true indicator of wealth, because it provides a more accurate representation of a typical income, especially in areas with significant income disparity.
When Should You Use Average Income
If your target market is high-income households, the average income may be more relevant. This is because the average income can highlight the presence of a higher concentration of wealthy individuals, which is beneficial for luxury goods and services marketing. We’re using average income on this page because using the Census’s highest reported median value of $250,001 could result in multiple ties for the richest geography.
Why do so many cities have a median value of $250,001?
The Census' American Community Survey uses $250,000+ as a jam value for median income estimates to protect privacy, ensure data consistency, and simplify reporting. A "jam value" in survey data refers to a placeholder or default value used when actual data points are unavailable, incomplete, or exceed certain thresholds. We represent this jam value as $250,001 to make it easy for you to sort.
You might also be interested in:
Email Me When New Data Are Released
Join thousands of subscribers and receive just 1 (ONE!) email a year in December when the US Census Bureau releases new income data for North Dakota richest counties.
SOURCES
United States Census Bureau. Annual Estimates of the Resident Population: April 1, 2020 to July 1, 2023. U.S. Census Bureau, Population Division. Web. May 2024. http://www.census.gov/.
United States Census Bureau. B01001 SEX BY AGE, 2023 American Community Survey 5-Year Estimates. U.S. Census Bureau, American Community Survey Office. Web. 12 December 2024. http://www.census.gov/.
United States Census Bureau. B19013 Median Household Income, 2023 American Community Survey 5-Year Estimates. U.S. Census Bureau, American Community Survey Office. Web. 12 December 2024. http://www.census.gov/.
United States Census Bureau. “DP03 SELECTED ECONOMIC CHARACTERISTICS.” 2023 American Community Survey 5-Year Estimates. U.S. Census Bureau, American Community Survey Office. Web. 12 December 2024. http://www.census.gov/.
Products & Services
Plumbing
Connect
- 1-800-939-2130
- Contact Us
© Copyright 2025 Cubit Planning, Inc.